Some of the data in this post were presented at Education Writers Association’s 75th National Seminar on July 25, 2022 in Orlando.
I was pleased to see the National Assessment Governing Board (NAGB) recently release a report on the 90th-10th percentile achievement gaps, the gaps between high (90th percentile) and low (10th percentile) achievers. It's true that the pandemic has exacerbated a widening between those two groups, but it was a trend already in place before Covid-19. Look at longer term, pre-pandemic trends, the publication urges.
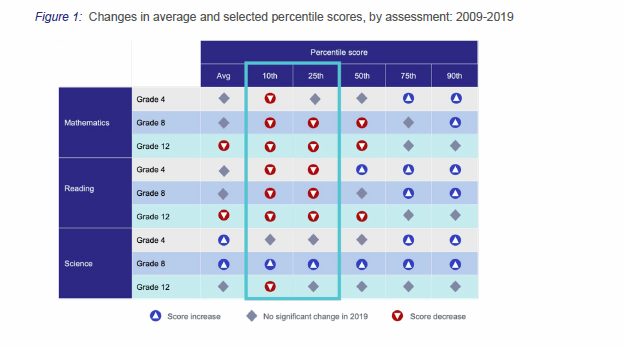
The NAGB report examines 2009-2019 scores. Here's the key table. Notice, at all grades, the down arrows for the 10th percentile in reading and math. For the 90th percentile, up arrows are present at 4th and 8th grades but not the 12th grade.
The Great Unwinding
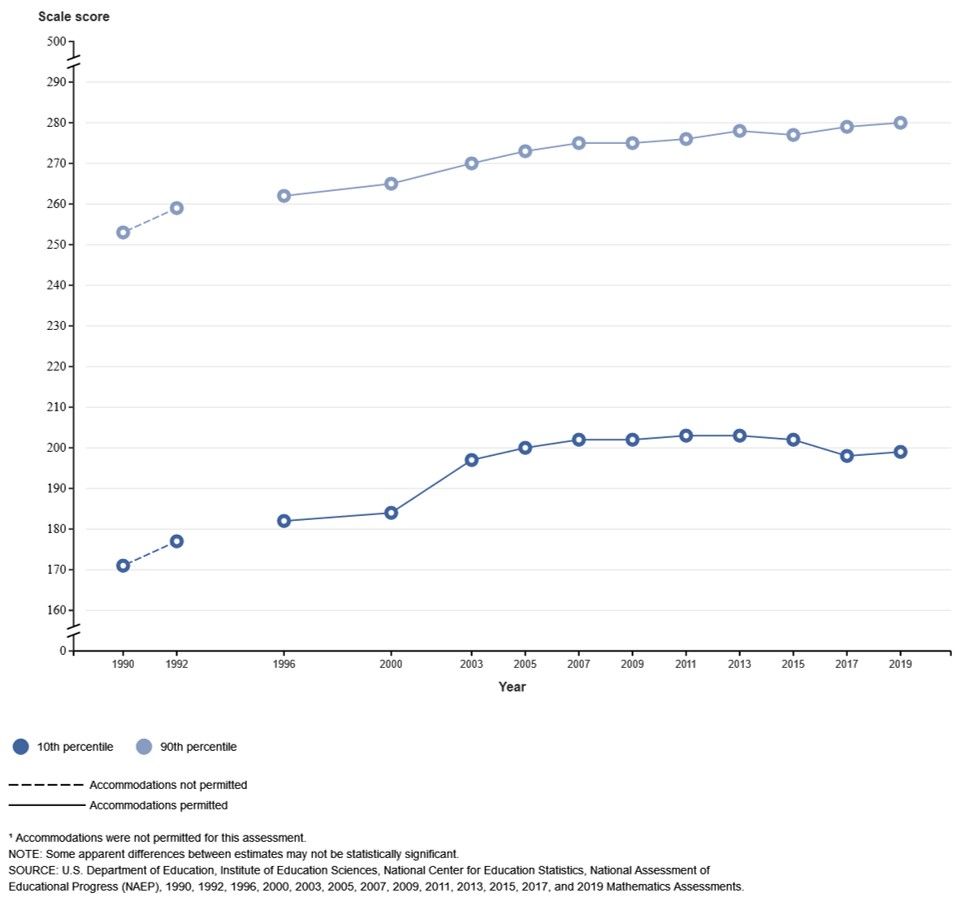
The next chart presents an even longer view of changes in the 90-10 gap, going back to the main NAEP of 1990. The chart focuses on 4th grade math. The gap in 1990 was 82 scale score points. It shrank to 73 points in 2009 but by 2019 had expanded back to where it was in 1990, 82 points. This unwinding or reversal of NAEP trends is interesting. Early evidence on pandemic effects indicated that gap widening would continue, with scores of low achievers declining and high achievers either treading water or increasing.
The 2022 results for the Long Term Trend NAEP (LTT) confirm that gap widening continued from 2020-2022. In the following table, I've highlighted cells reporting the 90-10 gap at four different times in the 44-year history of the LTT NAEP for nine year olds in math. Please note that the main NAEP, shown in the previous line graph, and LTT NAEP are different tests, and scores are reported on different scales. The widest gaps were when the LTT test began in 1978 (93 points) and the most recent results in 2022 (105 points). Unlike the main NAEP, the 90-10 gap remained stable from 1990 to 2008, only increasing by a single scale score point (from 85 to 86 points). Since 2008, the LTT exhibits the same trend as the main NAEP, with significant expansion in the achievement gap between the nation's highest and lowest achievers. In both cases, the culprit is the dramatic drop in scores for students who struggle to learn math, those at the 10th percentile--and that trend pre-dates the pandemic by at least a decade.
NAEP, Long Term Trend, Age 9 Math, 90th-10th Percentile Gap (1978-2022)
|
Year |
10th Percentile |
90th Percentile |
90-10 Gap |
|
1978¹ |
171 |
264 |
93 |
|
1982¹ |
173 |
263 |
90 |
|
1986¹ |
177 |
264 |
87 |
|
1990¹ |
186 |
271 |
85 |
|
1992¹ |
185 |
271 |
86 |
|
1994¹ |
187 |
272 |
85 |
|
1996¹ |
187 |
274 |
87 |
|
1999¹ |
187 |
275 |
88 |
|
2004 |
193 |
280 |
87 |
|
2008 |
198 |
284 |
86 |
|
2012 |
197 |
286 |
89 |
|
2020 |
191 |
286 |
95 |
|
2022 |
178 |
283 |
105 |
¹ Original assessment format.
NOTE: Some apparent differences between estimates may not be statistically significant. Some differences may not add up because of rounding.
Source: NAEP Data Explorer https://www.nationsreportcard.gov/ndecore/xplore/ltt.
-------------------------------------------------------------------------------
The long term trend NAEP in reading has 51 years of data going back to 1971. The 90-10 gap was quite large in the beginning (109 points) but grew even larger by 1990 (116 points). Then, as in math, the gap declined until 2008, bottoming at 94 points. It has widened since then, reaching 110 points in 2022.
NAEP, Long Term Trend, Age 9 Reading, 90th-10th Percentile Gap (1971-2022)
|
Year |
10th Percentile |
90th Percentile |
90-10 Gap |
|
1971¹ |
152 |
260 |
109 |
|
1975¹ |
159 |
258 |
99 |
|
1980¹ |
165 |
262 |
97 |
|
1984¹ |
157 |
263 |
106 |
|
1988¹ |
157 |
263 |
106 |
|
1990¹ |
150 |
266 |
116 |
|
1992¹ |
156 |
260 |
104 |
|
1994¹ |
156 |
260 |
104 |
|
1996¹ |
160 |
260 |
100 |
|
1999¹ |
158 |
259 |
101 |
|
2004¹ |
169 |
264 |
95 |
|
2004 |
162 |
263 |
100 |
|
2008 |
171 |
265 |
94 |
|
2012 |
171 |
266 |
95 |
|
2020 |
164 |
267 |
103 |
|
2022 |
155 |
265 |
110 |
¹ Original assessment format.
NOTE: Some apparent differences between estimates may not be statistically significant. Some differences may not add up because of rounding.
Source: NAEP Data Explorer https://www.nationsreportcard.gov/ndecore/xplore/ltt.