In February, 2023 Bari Weiss produced a podcast, “Why 65% of Fourth Graders Can't Really Read” and Nicholas Kristof, New York Times columnist, wrote “Two-Thirds of Kids Struggle to Read, and We Know How to Fix It.” Both headlines are misleading. The 65% and two-thirds figures are referring to the percentage of 4th graders who scored below proficient on the last reading test of the National Assessment of Educational Progress (NAEP), administered in 2022.
The problem is this: scoring below proficient doesn’t mean “can’t really read” or “struggling to read.” It also does not mean “functionally illiterate” or identify "non- readers” as some of the more vituperative descriptions on social media have claimed. It doesn’t even mean “below grade level in reading,” one of the milder distortions.
Both press reports were second-hand accountings of Emily Hanford’s series, Sold a Story. Hanford immediately took to Twitter to try to clear up the matter.
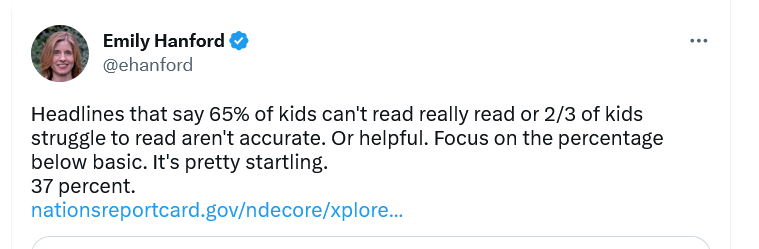
Not accurate. Not helpful.
Emily Hanford is right. Focus on below basic.
This post is on what scoring NAEP proficient means. It’s a very high standard. I present three pieces of evidence to convince you of that. I won’t present a treatise on the definition of “proficient,” even though NAEP’s definition isn’t what most people think—or most dictionaries say—that the word means. Instead, I’d like readers to grasp the meaning by comparing it to other empirical measures.
1992’s Fourth Graders
Let’s go back to 1992 and look at 4th graders’ NAEP reading scores.
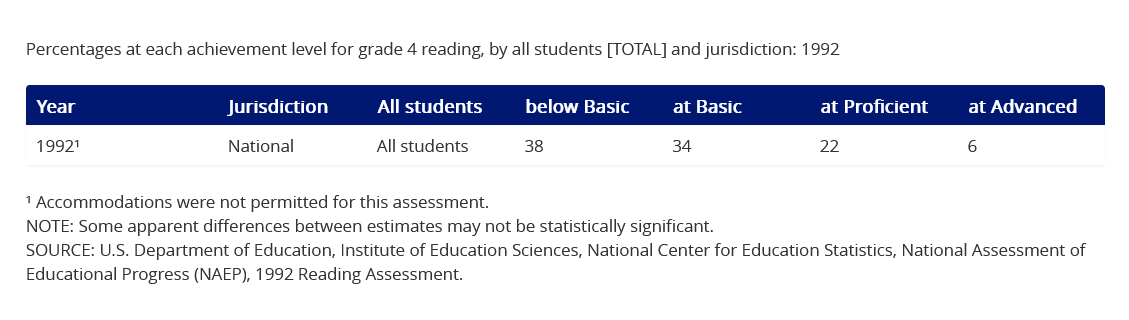
Seventy- two percent below proficient! They scored significantly worse than 2022’s 4th graders, whose scores (66% below proficient) were considered a disaster. But unlike today’s 4thgraders, we can ascertain how accurate NAEP scores were at predicting the 1992 cohort’s future. Those 4th graders are now about 40-41 years old.
How are they doing? Quite well indeed. Based on earned college degrees, a recent Brookings report dubbed American millennials (born 1981-1996) “the most educated generation in the nation’s history.” Struggling to read as a fourth grader is a serious issue, often with lifetime consequences. It is doubtful that 72% of 1992’s 4th graders—the leading edge of millennials—struggled with reading or couldn’t really read and then went on to graduate from high school, attend college, and attain post-secondary education at record-smashing rates. Actual outcomes do not bear out the bleak outlook of the 1992 data.
Florida 2011
Another good way to interpret NAEP performance is by comparing NAEP scores to scores on international tests. Fourth grade reading is assessed on the Progress in International Reading Literacy Study (PIRLS), which began in 2001 and is given every five years.[1] In 2011, the state of Florida decided to take part as its own entity (only public schools). Among the 53 participants (most were countries), Florida scored right at the top, in a statistical dead heat with four other participants (Hong Kong, Finland, Russia, and Singapore). Participants scoring statistically significantly lower than Florida included: Canada, Denmark, England, France, Germany, Italy, Netherlands, Norway, Poland, Portugal, and Sweden—and the United States as a whole.
Here’s how the National Center for Education Statistics described Florida’s score:
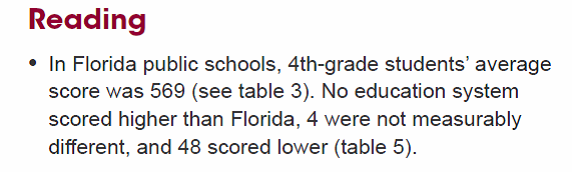
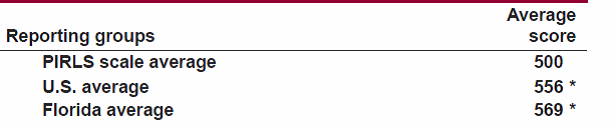
The asterisks indicate that both the U.S. and Florida scores sit significantly above the PIRLS average. With PIRLS pegged at an international average of 500 and a standard deviation of 100, a score of 569 is impressive by any measure.
2011 was also a NAEP year, and, as usual, Florida’s 4th graders took the reading test. How did they do?
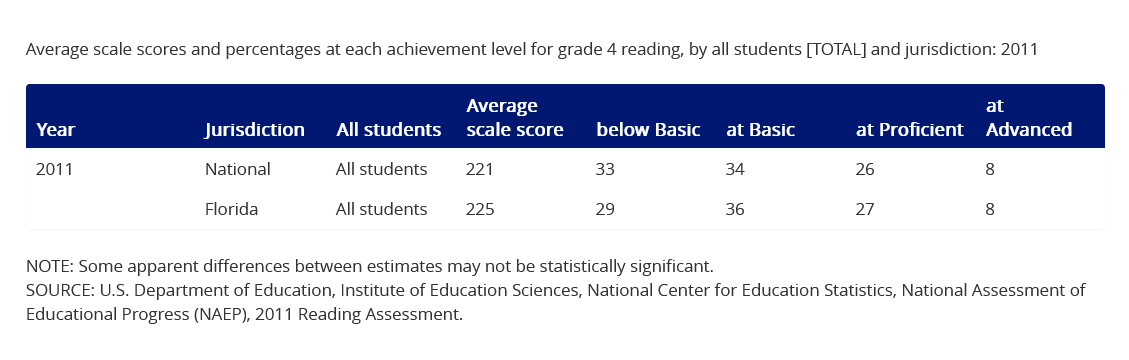
The 225 average scale score was okay—as on PIRLS, a little higher than the U.S. average[2]—but look at the achievement levels. Almost two-thirds (65%) scored below proficient. Do you think nearly two-thirds of Florida’s 4thgraders were reading below grade level in the same year that they led the world in reading? That makes no sense.
2018 NAEP Oral Reading Fluency Study (ORF)
In addition to the regularly scheduled assessments of academic achievement, NAEP periodically conducts special studies that enhance our knowledge of student learning. One such study is the Oral Reading Fluency Study (ORF), last given in 2018 and previously given in 2002 and 1992. The study links oral reading fluency to the NAEP performance categories.[3]
Oral reading fluency refers to “appropriate speed, accuracy, and expression when reading aloud,” and while related to decoding skills, as one would expect, fluency is also highly correlated with reading comprehension.[4] Timothy Rasinski, a noted expert on fluency who teaches at Kent State University, has a wonderful saying that the goal of phonics instruction is “to get readers not to use phonics when reading.”[5] That statement ties decoding to comprehension. Because you are fluent readers, those of you who have read this far in the blog post probably have not had to stop to sound out words. You already recognized them on sight--their identity and meaning—and this recognition took place so quickly, in just a fraction of a second (automaticity is the term), that you were able to understand clumps of words (phrases, clauses, sentences) and meld them together to comprehend text. Not only does that process transpire in the blink of an eye, fluent readers are practically unaware that it is happening.
I’d like to present data from the 2018 ORF study, focusing on two aspects of fluency—speed and accuracy—but before doing so it is important to issue a couple of warnings. First, the fact that speed is intrinsic to fluency does not mean kids will become more fluent readers if we just make them read faster. Timothy Shanahan, a literacy scholar at the University of Illinois-Chicago, has a terrific blog post explaining why reading speed is a valuable assessment metric but not, in a general sense, a great instructional objective. The second warning is that I am only discussing two of many important components of reading and two findings from this particular study. I urge readers to spend more time exploring the study on their own.
How the Study Was Conducted
The study was conducted with a nationally representative sample of over 1,800 fourth-graders from 180 public schools. Students were given a NAEP reading test, followed by a test of oral reading consisting of short passages, word lists, and pseudo-word lists to be read aloud.[6] The oral reading assessment was given on tablets, with oral student responses scored by an automatic analysis system that generated rate, accuracy, and words correct per minute (WCPM) statistics, common measures of oral reading fluency. In addition, the 36% of 4thgraders scoring Below Basic on the NAEP achievement levels were divided into three equal groups: below NAEP basic Low, below NAEP basic Medium, and below NAEP basic High. This disaggregation proved to be important in producing a more finely-grained understanding of low performance on NAEP.
Results
A fluency metric common to oral reading screening assessments is words correctly read per minute (WCPM). It combines speed and accuracy in a single measure. As expected, the 2018 ORFS generated WCPMs of passage reading that stair-step down the NAEP proficiency levels (from right to left in the figure below), with NAEP advanced students scoring 160, NAEP proficient, 142, and NAEP basic, 123. The three below NAEP basic groups score lower still, but it’s notable that the gap between the lowest and highest scoring below basic groups (71 and 108) is equal to the gap between Basic and Advanced (123 and 160). The lower tail of the distribution, falling below basic, contains a lot of heterogeneity that a single label fails to reveal.
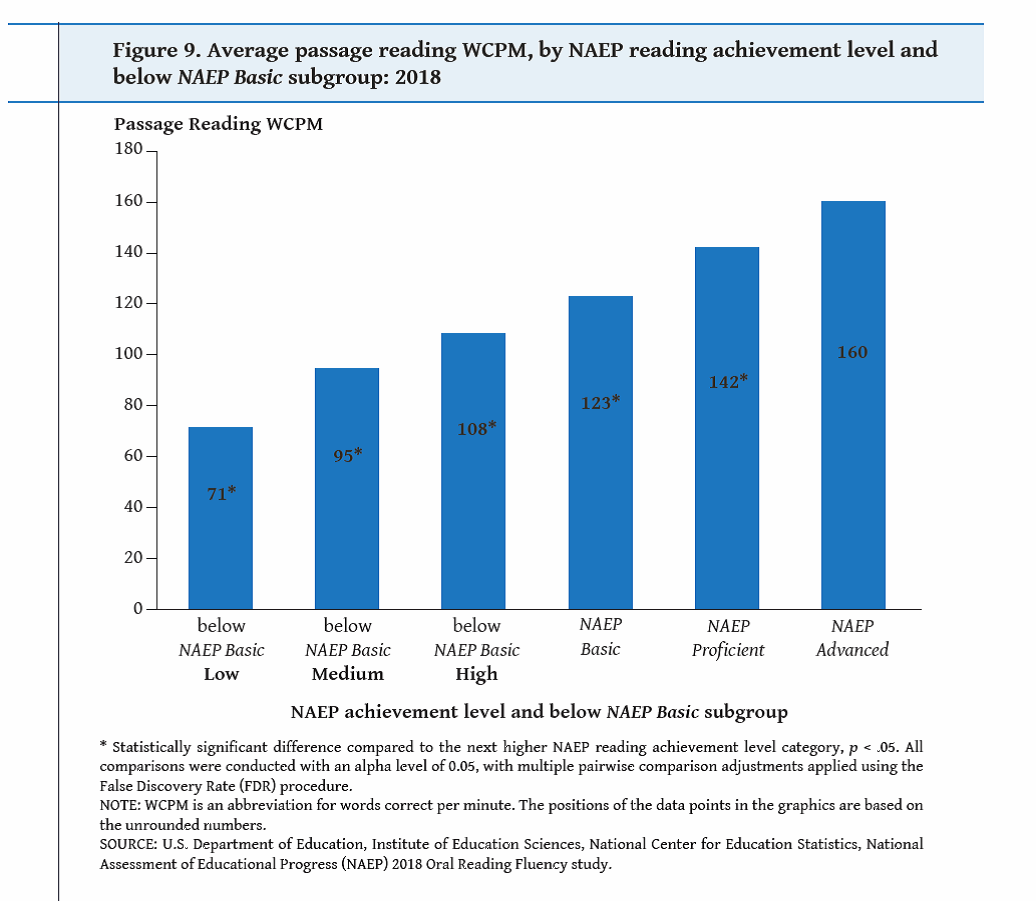
Jan Hasbrouck and Gerald Tindal published norm tables in 2017 based on commonly administered ORF assessments, describing the within-grade distribution of WCPM scores. Examining the median student score (50th percentile) for the Winter trimester of 4th grade (middle of the year) is illuminating, especially in regards to NAEP Basic and NAEP Proficient. The NAEP Basic score of 123 WCPM is 3 more than the 4th grade median of 120; the NAEP Proficient score of 142 is 1 less than the 75th percentile score of 143. This suggests that the average performance of a NAEP Basic 4th grader on the ORF is close to typical for that grade level, while the NAEP proficient student’s score on the ORF is almost in the upper 25%.[7]
Reading accuracy removes the element of speed and looks solely at the percentage of words read correctly, including words initially read incorrectly but immediately corrected. Although the benchmark of 90% accuracy signifying “instructional level,” is controversial—and less than that as a student’s “frustration level” even more controversial--most literacy scholars accept that 90%-95% accuracy is in the vicinity of a typical reader’s Goldilocks’s level—reading text that is not too hard and not too easy. An 80% accuracy level, on the other hand, suggests a reader needing scaffolding: help from an instructor, a tutor, or parent. A 100% level indicates readers already know every word.
Let’s look at the data.
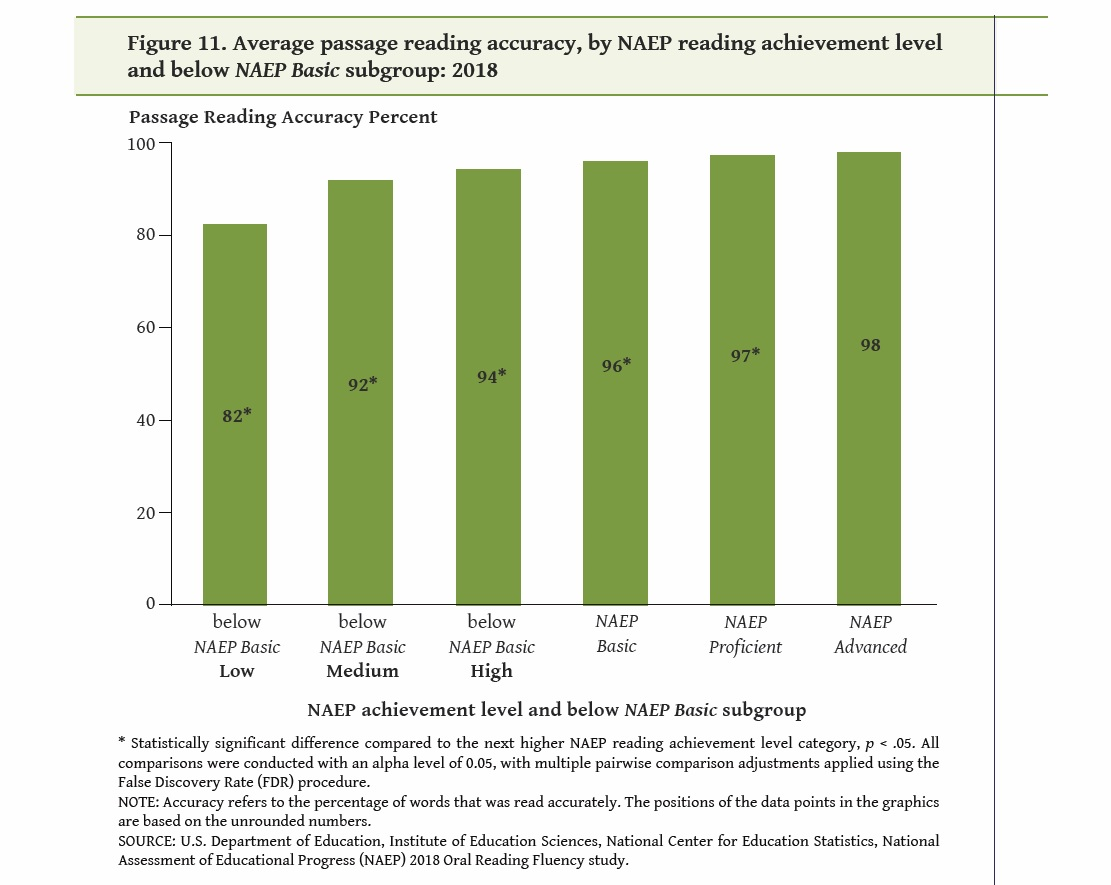

Notice three things. First, students at NAEP Basic average 96% accuracy, a level that no literacy expert would consider as identifying non-readers. Second, students at NAEP proficient demonstrate 97% accuracy, only one more word per 100 read accurately than NAEP Basic students.[8] And third, notice the below NAEP Basic low group, 82% of words read accurately. They are struggling mightily, constitute about one out of eight of the nation’s 4th graders, and need urgent policy attention.
Summary and Implications
In 1992, 72% of 4thgraders scored below proficient on the NAEP reading test. And yet that cohort went on to earn college degrees, both 4-year and graduate, at rates never accomplished by previous generations. In 2011, 4th graders from the public schools of Florida scored at the very top of the world league tables on PIRLS, an international assessment of reading, yet the NAEP achievement levels that same year showed two-thirds of Florida’s 4th graders scoring below proficient. The 2018 NAEP Oral Reading Fluency Study revealed that students scoring at NAEP Basic can read with 96% accuracy, only 1% point less than the 97% rate registered by students scoring at NAEP Proficient. No parents of twins, after hearing their two children read out loud, are going to conclude that one child can read and the other can’t if they register 97% and 96% accuracy rates.
I am not a psychometrician; I study education policy. As a policy analyst, I follow NAEP scores and discussions about them. Probably 2-3 times a week I see, (sometimes from a news outlet but especially on Twitter) students who score at basic described as “below grade level” or as “not being able to read,” or as “struggling at reading”…or worse. It means none of those things. Bari Weiss and Nicholas Kristof are not alone in being confused by what proficient means on NAEP tests.
Why Does It Matter?
The defense for setting proficient at a very high level is best articulated by Chester E. Finn, Jr., chair of the governing panel that adopted the levels, and someone I greatly admire. Finn describes the NAEP performance levels as aspirational. I get that, but I don’t want NAEP to be aspirational. That transforms NAEP from an empirical measure into an instrument of reform, the form of which in a democracy will always be debatable. Just give me a score. I don’t want my thermometer to be aspirational (just tell me what my temperature is). I don’t want my weight scale to tell me what I should weigh. Give me the facts.
NAEP has been aware of the potential to misinterpret proficient for a long time. The NAEP website cautions: “It should be noted that the NAEP Proficient achievement level does not represent grade level proficiency as determined by other assessment standards (e.g., state or district assessments).”[9] The problem isn’t localism. As the PIRLS results discussed above demonstrate, NAEP proficient does not represent grade level anywhere in the world. But, sadly, people think that “proficient” must be the dictionary definition or similar to how reading scholars have conventionally used the term.[10]
Federal officials in charge of education statistics know of this problem. Peggy Carr, Commissioner of the National Center for Education Statistics estimated that NAEP Basic is closer to grade level than NAEP Proficient. I agree with that, and the data presented in this post support that interpretation.
Besides being inaccurate, what’s the harm?, Whether in the New York Times or on Twitter, Chicken Little commentary leads the public to believe that a significantly low level of literacy plagues far more children than it really does. Such alarmism misdirects policy and takes a toll on children who are truly struggling to learn how to read.
In a January, 2023 interview in Education Week, Mark Schneider, Director of the Institute of Education Sciences, singled out the policy consequences of the past two decades’ hyper-focus on proficient.
“[The goal was] to turn everybody into a proficient reader, writer, science, math [student]. Obviously, that didn’t happen, but because we were focused on getting everybody past the proficiency mark, we paid less attention than we should have to what was going on below basic. But the trend of the below-basic [students’ achievement] falling is something that’s gotten worse.”
If you are interpreting NAEP scores in a public forum, please do so accurately. Accuracy is an occupational virtue of both journalists and government officials, but even Twitter pundits should pay attention. The paramount importance of getting the term “proficient” right as applied to NAEP scores, a simple matter of correct vocabulary, should be obvious when discussing—of all things—children learning how to read.
[1] The latest PIRLS scores (2021) were released on May 16, 2023.
[2] The 2011 national SD was 36, making Florida’s outperformance relative to the U.S. average on PIRLS and NAEP similar in magnitude. Note that the U.S. sample includes both public and private schools, whereas Florida’s PIRLS sample was restricted to public schools. Figures are from p. 12 of Thompson, S., Provasnik, S., Kastberg, D., Ferraro, D., Lemanski, N., Roey, S., and Jenkins, F. (2012). Highlights From PIRLS 2011: Reading Achievement of U.S. Fourth-Grade Students in an International Context (NCES 2013–010 Revised). National Center for Education Statistics, Institute of Education Sciences, U.S. Department of Education. Washington, DC. Government Printing Office.
[3] White, S., Sabatini, J., Park, B. J., Chen, J., Bernstein, J., and Li, M. (2021). Highlights of the 2018 NAEP Oral Reading Fluency Study (NCES 2021-026). U.S. Department of Education. Washington, DC: Institute of Education Sciences, National Center for Education Statistics. Retrieved from https://nces.ed.gov/pubsearch/pubsinfo.asp?pubid=2021026.
[4] 2018 ORF Study, page 2.
[5] https://therobbreviewblog.com/uncategorized/get-readers-not-to-use-phonics-when-reading/
[6] The NAEP reading test was slightly truncated but produced valid scores for the 2018 ORF Study.
[7] The norms are only provided for rough estimates considering that most ORF assessments have been administered following different protocols (for example, individually by an adult, not by computer).
[8] Note: if a student reads 3 words out of 100 incorrectly, then reads 4 words out of 100 incorrectly, the rate of words missed has increased by 33%. If expressed as percentage of words missed, the difference between 96% and 97% accuracy rates appears much larger than a single percentage point.
[9] The NAEP website added the qualifier about local assessments sometime after June, 2016. The original wording was: “Proficient is not synonymous with grade level performance,” cited in The NAEP Proficiency Myth, a blog post I authored at Brookings in 2016. More information on setting NAEP performance levels is available at: https://nces.ed.gov/nationsreportcard/set-achievement-lvls.aspx
[10] For an intriguing account of the entanglement of politics and science that led to the creation of the NAEP performance levels, see Vinovskis (2001).