In my recent book, Between the State and the Schoolhouse: Understanding the Failure of Common Core, I examine achievement gaps between different racial and ethnic groups. To guide the analysis, scores from the National Assessment of Educational Progress--for Asian/Pacific Islanders, Blacks, Hispanics, and whites--are provided from 1990 to 2019. These four racial/ethnic groups make up about 95% of the NAEP testing population. Here I would like to add to the book's discussion and point out some of the most interesting trends in the data.
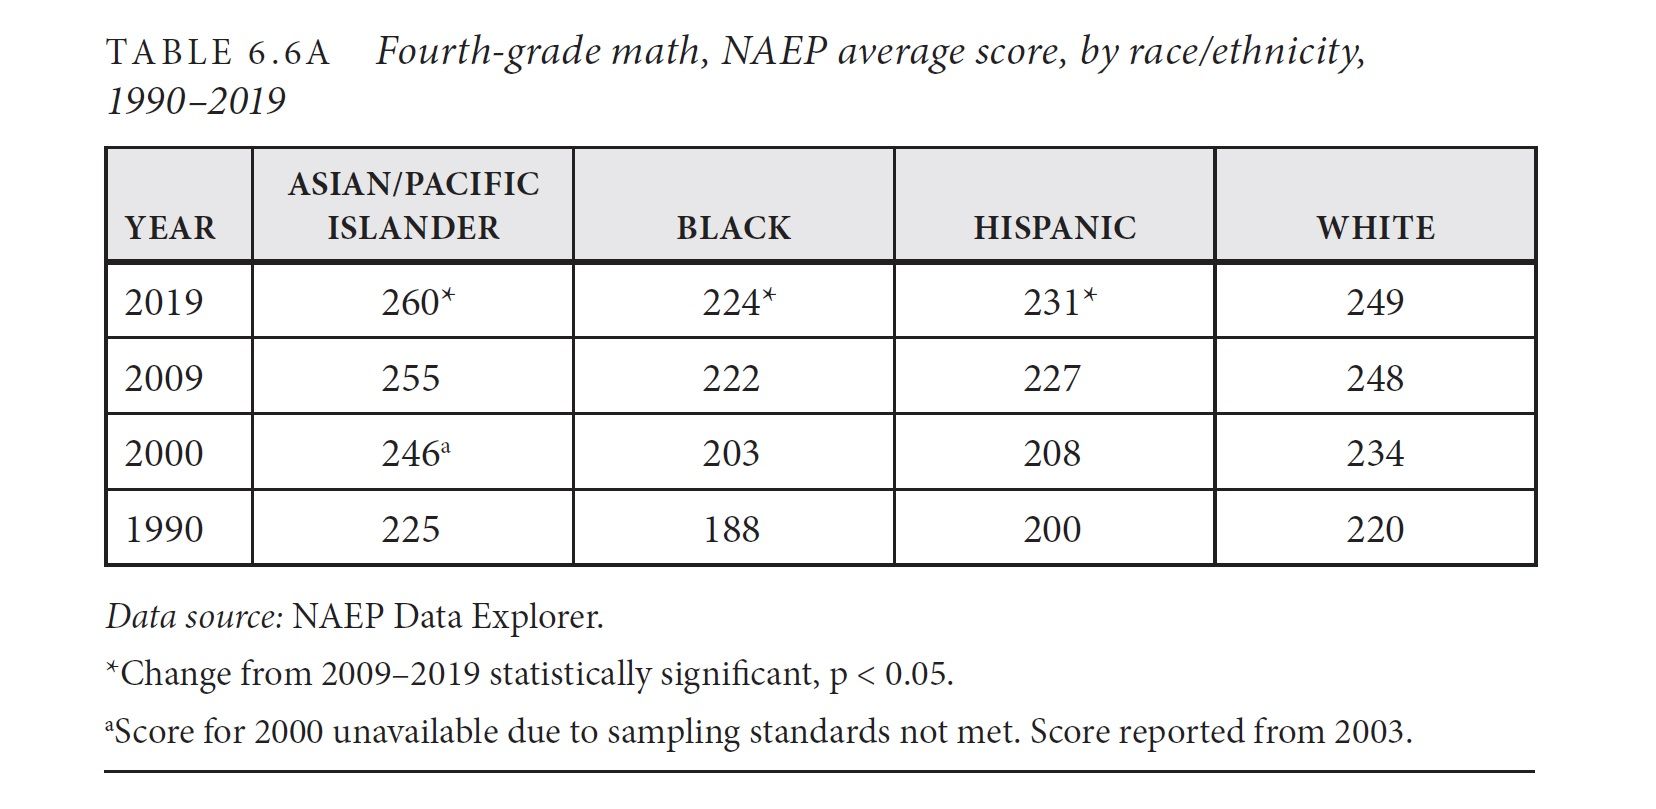
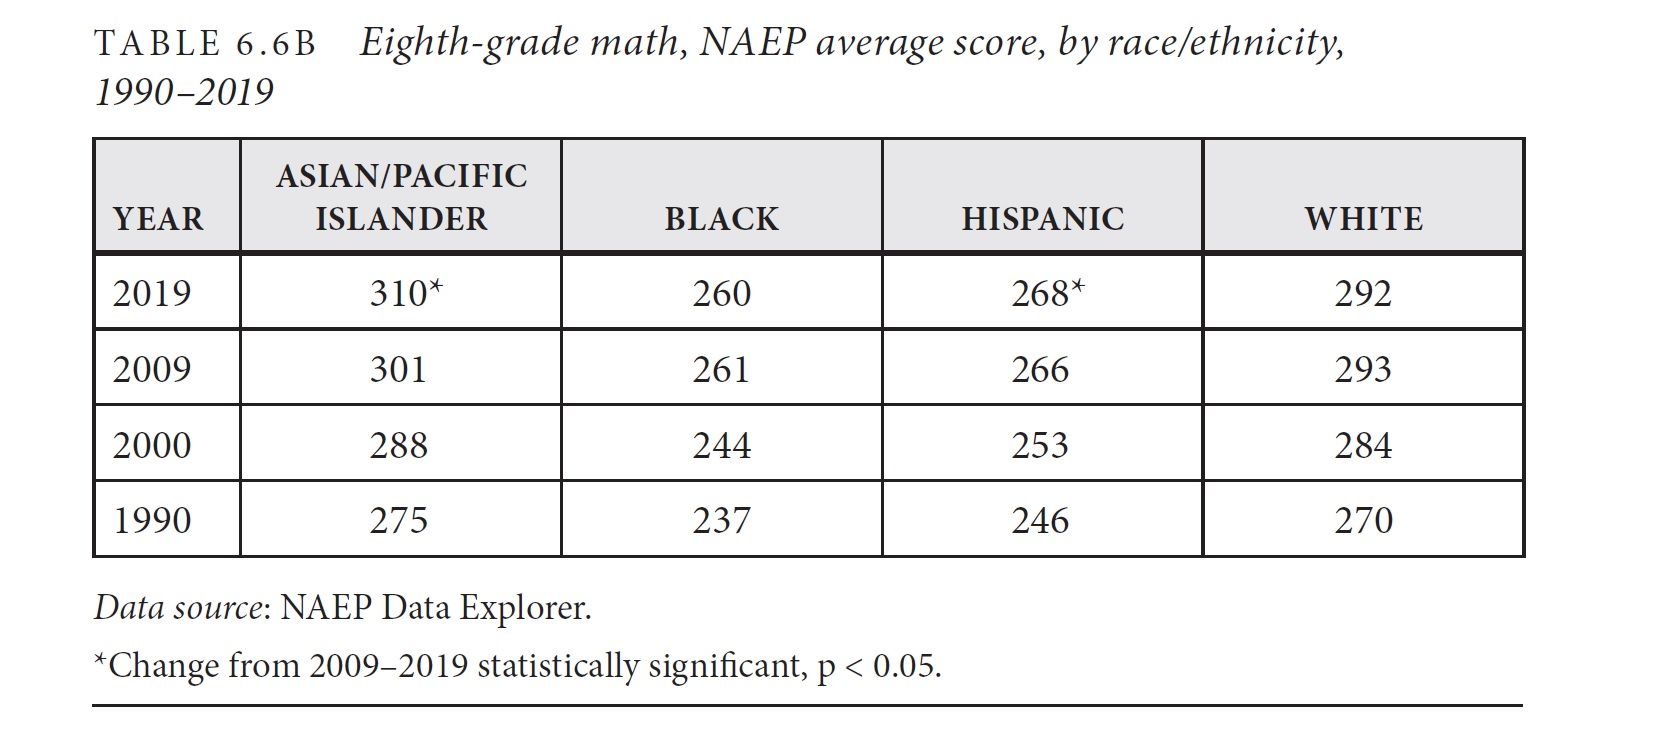
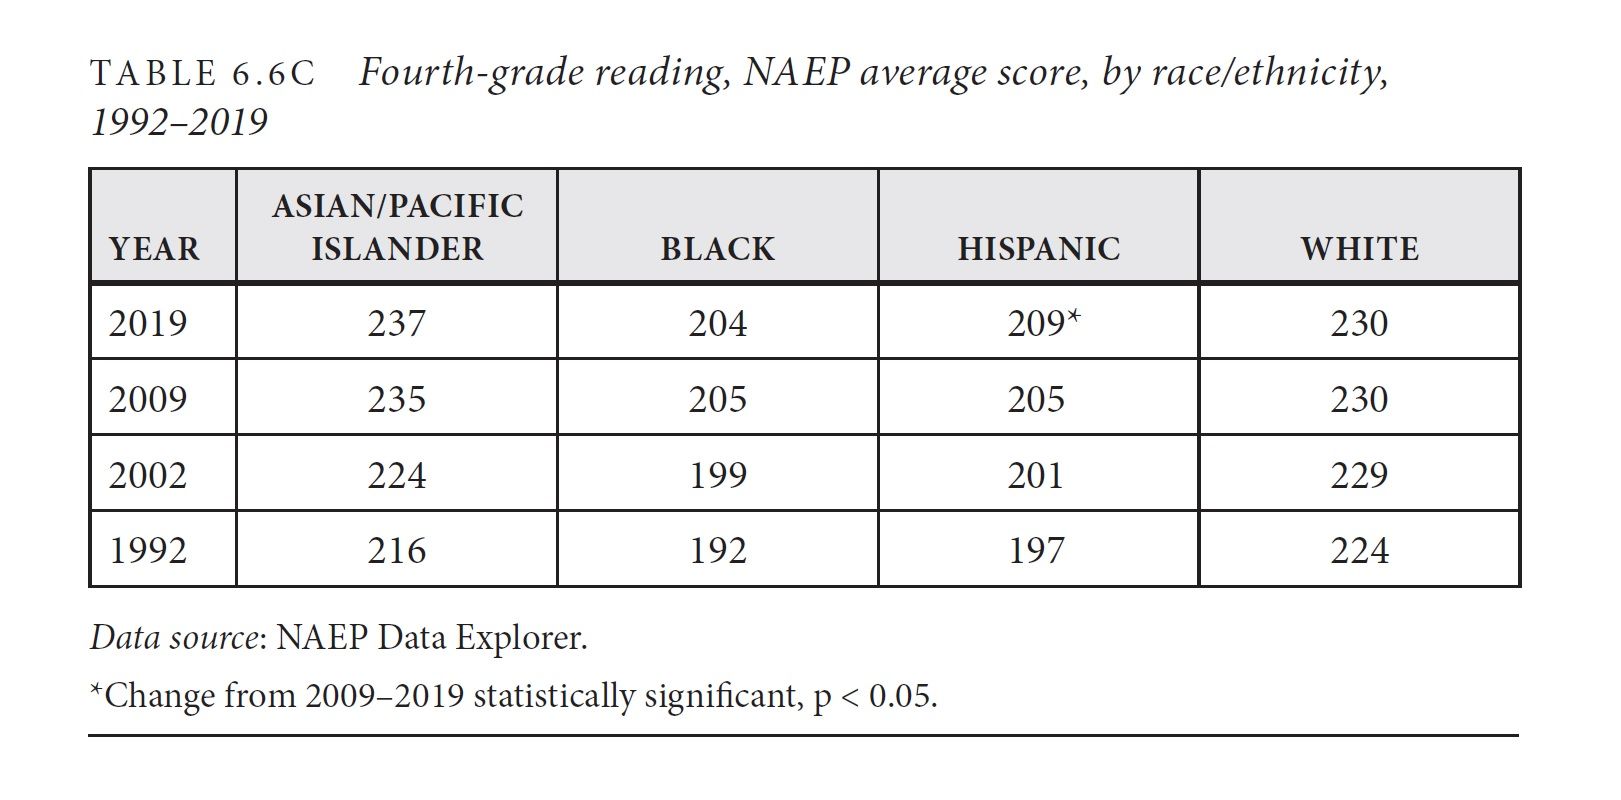
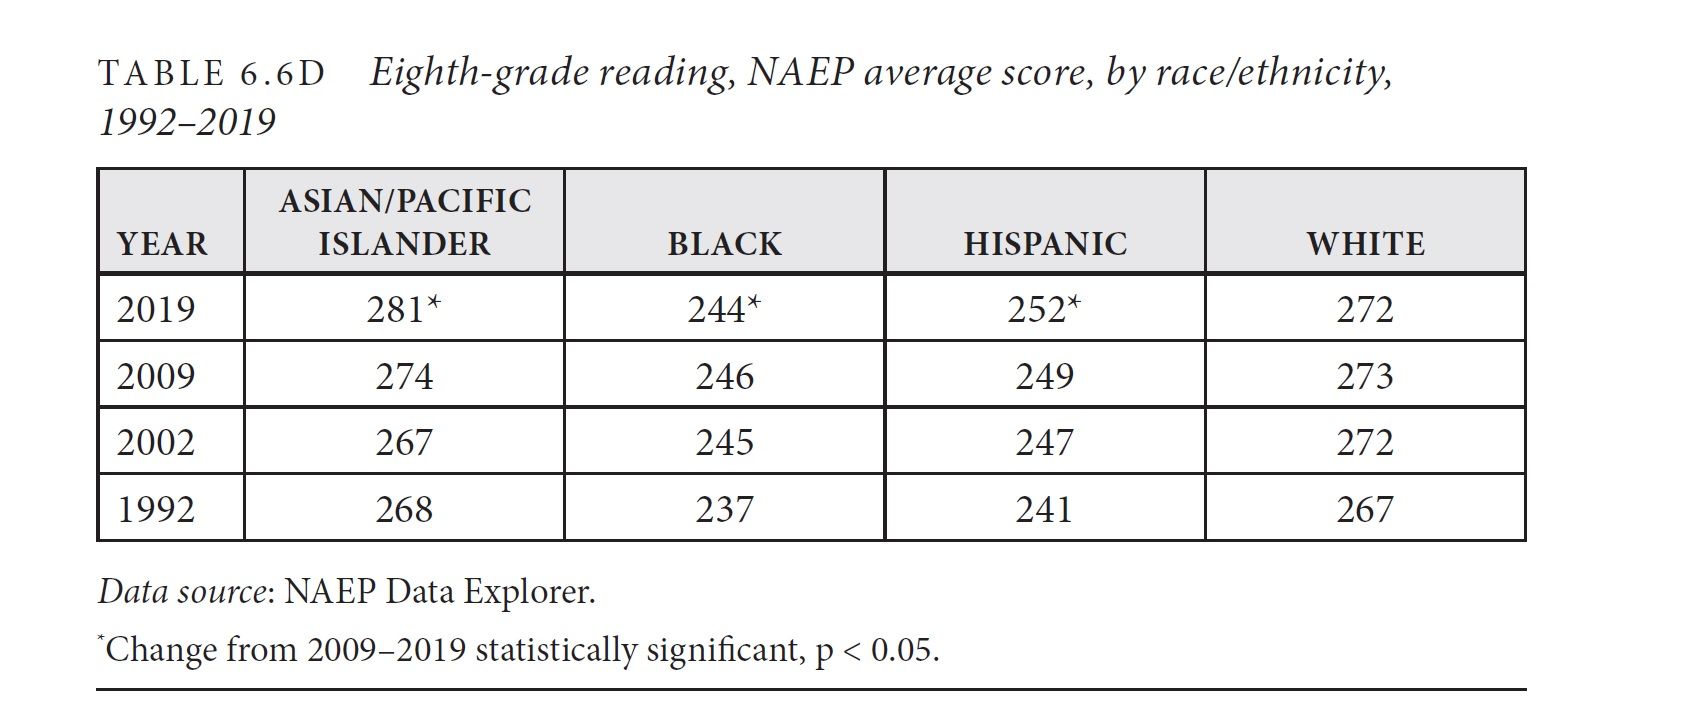
A few housekeeping items. I recommend printing out the four tables below so that they can be easily consulted while reading the analysis. The first two tables report scores in math (fourth and eighth grades). The third and fourth tables display scores for reading. Asterisks in the top row (i.e., scores from 2019) indicate a statistically significant change from 2009 to 2019. The years reported approximately divide the scores into decades, but not perfectly, as NAEP tests were not administered on a regular schedule before 2003. From 2003-2019, tests were administered every two years. The 2021 NAEP was cancelled due to the pandemic. The 2000 4th grade math score for Asian/Pacific Islanders was not reported so the 2003 score is shown. All scores are from the Main NAEP assessment, not the Long Term Trend, which is a different NAEP test, last given in 2012. On the Main NAEP, math assessments started in 1990, reading in 1992.
The discussion begins after the tables.
Major Findings
1. NAEP results for 2009-2019 look more encouraging when disaggregated by race rather than examined as a whole. National scores in all four subject-grade combinations have been mostly flat, leading commentators to dub 2009-2019 a "lost decade."
The discrepancy illustrates a statistical phenomenon known as Simpson's Paradox, when trends for an entire population look different for subpopulations constituting the whole. In 4th grade math, for example, the national NAEP scores were 240 in 2009 and 241 in 2019, a statistically insignificant gain of one scale score point; and yet, Asian/Pacific Islanders, Blacks, and Hispanics all notched statistically significant gains. In 8th grade reading, the national score actually fell one point (264 to 263), but, again, three out of four groups registered progress, and only white students failed to make statistically significant gains.
2. One of the most under-reported NAEP stories is that Hispanic students made statistically significant gains on all four NAEP tests over the past decade. Asian/Pacific Islanders made gains on three tests. Scores for Black students rose in 4th grade math, but fell in 8th grade reading. No change in white scores reached statistical significance.
Statistical significance is not the same as a meaningful change. NAEP scores are estimates based on scientific sampling. Statistically significant gains or losses simply mean that we can be confident, based on calculations of sampling error, that the true change in score is different from zero. The 2009-2019 Hispanic gain of two points in 8th grade math, for example, is statistically significant, but small in a real world sense, representing about 0.06 of the 2009 standard deviation (36). It's unlikely such a change would be noticeable, especially if unfolding over a decade.
3. Almost all of the longer term changes in NAEP scores are significant in every sense of the word. From 1990-2019, Black students registered the largest grade-subject gain, with 4th grade math scores rising by a whopping 36 points (188 to 224). Small gains that accumulate incrementally can add up to something substantial over time. The 36 point gain represents 1.13 standard deviations on the NAEP scale (standard deviation of 32 in both 1990 and 2019). Interpreted with the ballpark estimator used by many NAEP analysts--ten points being equal to one grade level--the gain represents about 3 1/2 grade levels of progress. In plain English, it suggests that the average Black fourth grader in 2019 knew about as much math as the average Black seventh grader in 1990. Indeed, the 1990 8th grade math score for Blacks was 237 so estimating that a score of 224 typified the performance of a Black 7th grader in 1990 does not appear far off the mark.
4. A few general trends were evident by the early 2000s and have persisted. Gains have tended to be, with a few exceptions, larger in math than in reading, larger in 4th grade compared to 8th grade, and larger in either the 1990s or 2000s than in the 2010s. That's true for both national NAEP scores and, as shown above, for scores disaggregated by racial and ethnic groups. The 12th grade NAEP, which is given less often, comports with the "younger gains more" pattern by revealing that 12th graders made the smallest gains of all three grades assessed by NAEP.
Summing Up
A caveat. The data are cross-sectional and do not control for within-group changes that may affect learning. Characteristics such as parental education and employment, family income, and immigration, language, or special education status can change from cohort to cohort. Within a particular racial or ethnic group, today's fourth and eighth graders may be different from kids within that same racial or ethnic group in the early 1990s--and different in ways that influence math and reading achievement.
Do these NAEP scores offer any hints as to what to expect in a post-pandemic world? It's hard to say. Early indications are that younger students have experienced a more serious decline in test scores than older students and that declines in math outstrip those in reading--the exact opposite of trends in the past three decades of NAEP scores. That's intriguing but could be only a coincidence. NAEP is not constructed to provide easy causal explanations. The credibility of causal inferences can be enhanced by using multiple panels of NAEP data and controlling for changes in variables correlated with achievement. To assess the toll inflicted by the virus--and to identify the best strategies for reversing the virus's negative impact on learning--several panels of post-pandemic data will be needed. And for the latter task, identifying effective interventions, ideally, carefully designed evaluations will be conducted to provide the kind of causal analysis for which NAEP is ill-suited.