When this year’s NAEP results are released in the fall of 2022, currently scheduled for October, they will provide the first snapshot of how much student learning has been affected by the pandemic. Changes in state scores always receive attention. How should the magnitude of changes from the previous score be interpreted? Is a two point change in fourth grade reading large or small? How about a three point change in eighth grade math? This post offers readers a tool for interpreting changes in state NAEP scores based on historical data.
Background
The National Assessment of Educational Progress (NAEP) administers tests of academic achievement, primarily in fourth and eighth grade reading and mathematics. The version of the test that produces state scores, known as the main NAEP, was first given in math in 1990 and in reading in 1992.[i] From 1990-2002, the state NAEP tests were voluntary and administered sporadically. The states that participated and the length of time between tests varied from test to test. Beginning in 2003, all states have been required by federal law to assess fourth and eighth graders in both reading and math, producing four grade-subject scores for each state. The post-2003 NAEP tests were administered in odd numbered years although the pandemic disrupted that routine with the cancellation of the 2021 test. After this year’s assessment, subsequent NAEPs are scheduled for even-numbered years.
Changes in NAEP scores draw attention for a reason. Pundits often cite large test score changes as evidence that a particular state has adopted wise policies if its scores go up or imprudent policies if its scores go down. Unfortunately, such causal inferences are rarely warranted. Changes in scores may be reported as statistically significant, but this statistic, too, is widely misunderstood. Statistical significance confirms that we can be confident that the gain or loss is different from zero, even after taking sampling error into account, but it does not mean that the gain or loss is substantive or possesses any real world significance.
The example Jacob Cohen gave in his 1969 paper on effect sizes cited the difference in the average height of 15 and 16 year old American girls, about 0.2 standard deviations, a difference almost impossible to discern by sight. But that difference, the equivalent of about 8 scale score points on the 2019 NAEP test in eighth grade math, would not only be statistically significant, it would be hailed as an amazing achievement. From 2003-2019, the largest gain in eighth grade math was Maryland’s gain of 7.8 points in 2005-2007.
If statistical significance and effect sizes are unreliable guides to determining whether a NAEP score change is large or small, what other metric can we use? The analysis below presents an empirical answer to that question based on the history of state NAEP scores.
Methods
I used the Main NAEP Data Explorer to calculate every state’s 2-year change in NAEP score from 2003-2019. With fifty states, four grade-subject tests, and eight test intervals (2003-2005, 2005-2007, etc.), a total of 1600 test score changes were computed, 400 for each test. I replicated the analyses using unadjusted state scores from Urban Institute’s NAEP database, America’s Gradebook.
Caveat
The purpose of the analysis is to provide an empirical, historical analysis of changes in state NAEP scores based on back to back administrations. From 2003-2019, those were two-year intervals. The 2019-2022 changes will be based on a three-year interval. In addition, the data should be regarded as descriptive, not predictive.
Results
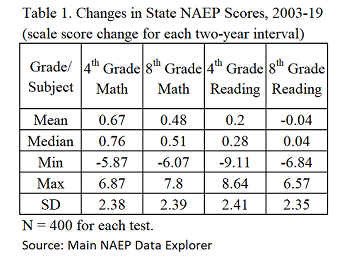
Table 1 displays summary statistics. Fourth grade math has the largest average gain (0.67) and eighth grade reading the smallest (-0.04), which makes sense considering fourth grade math also notched the largest national gain (235 to 241) over the same period, while eighth grade reading was the only subject-grade combination showing no progress at all (263 in both 2003 and 2019). Fourth grade reading possesses both the largest loss (-9.11 for Maryland in 2013-2015) and largest gain (8.64 for Alabama in 2005-2007).
Frequency Distributions
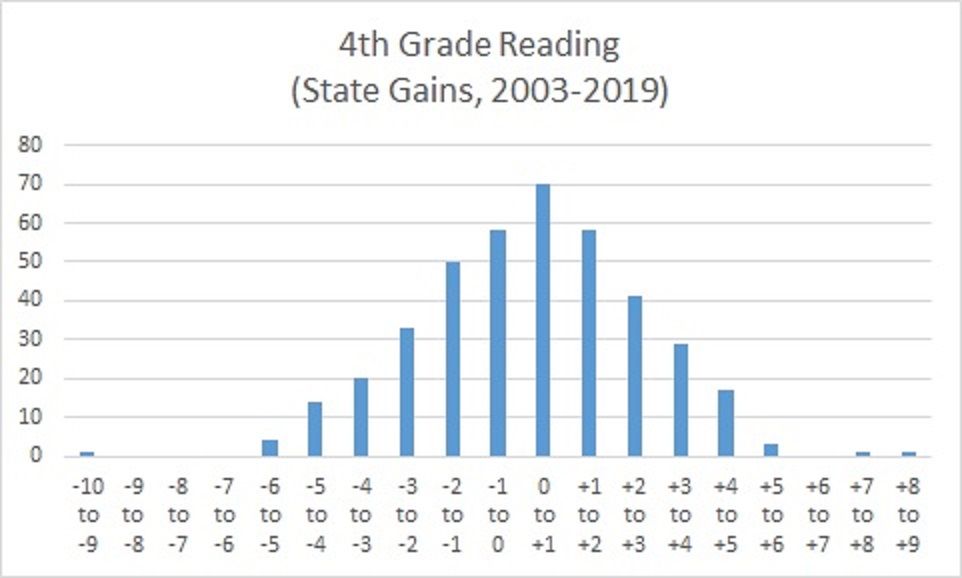
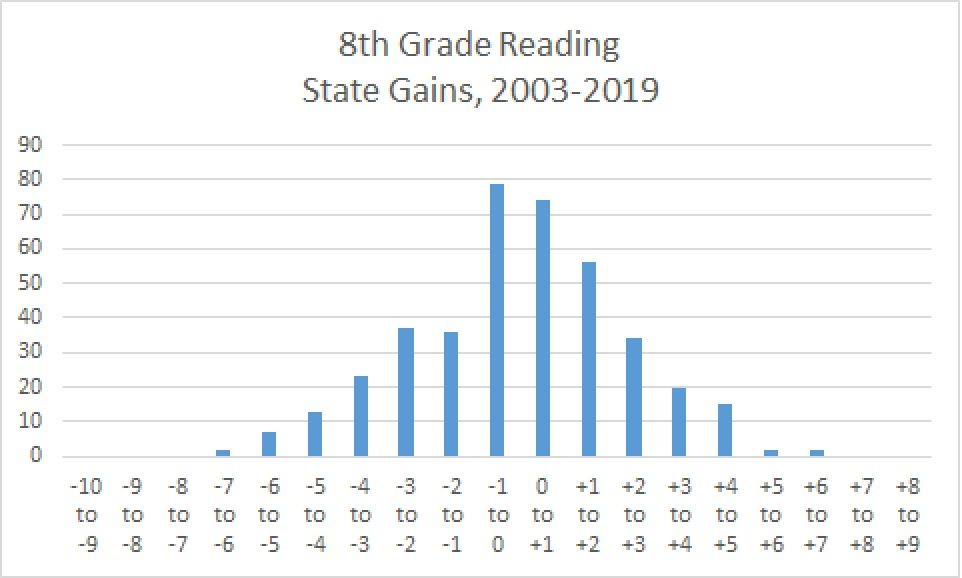
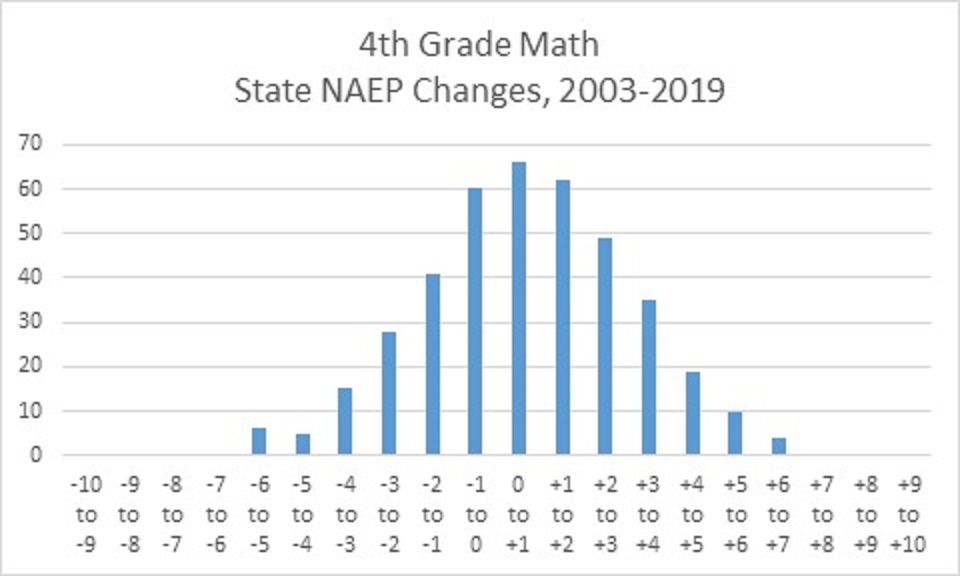
Sorting all of the interval changes into single-point bins produced frequency distributions that look near normal, in other words, except for some lumpiness, similar to bell curves.

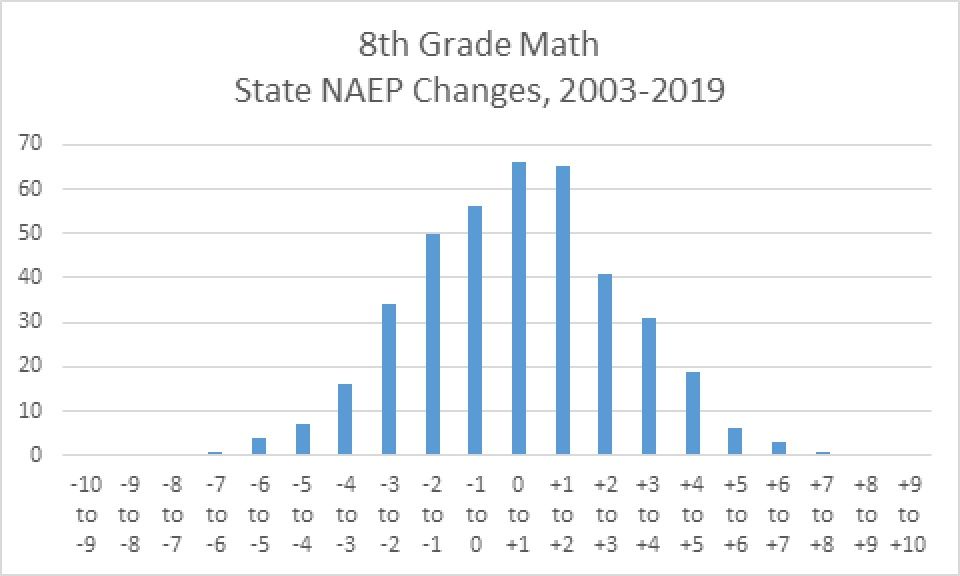
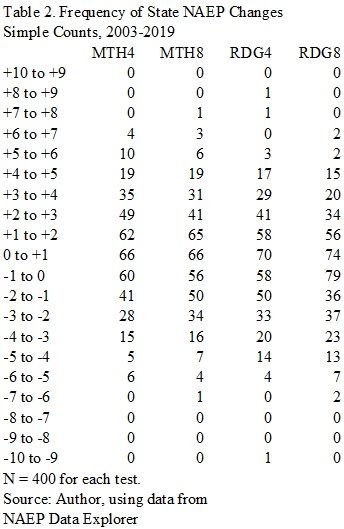
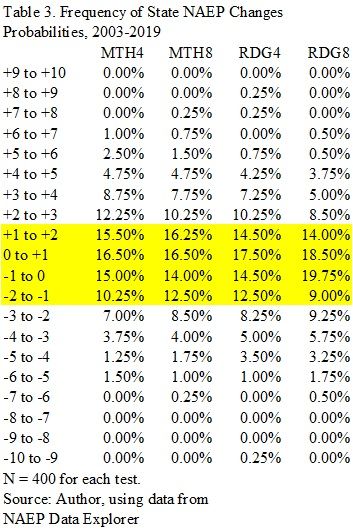
Tables 2 and 3 display the data as both simple counts and probabilities. In Table 3, the rows reporting gains or losses of two scale score points or less are shaded, and by adding the probabilities, readers can see that over half of state NAEP changes have fallen in that range on all four tests. It's also evident that gains or losses of six points or more are rare.
Pandemic Effects
Several studies have attempted to estimate the impact of school closures, remote instruction, family trauma, and other products of the covid pandemic on student learning. Recent analyses that include data from the 2021-2022 school year indicate that 2022 NAEP scores, in comparison to 2019, could decline by 0.10 standard deviations in reading and 0.20 standard deviations in math, with students who experienced longer periods in remote learning suffering larger losses. The scores of Black, Hispanic, and students in poverty also appear to have declined dispropotionately. [ii]. A hopeful but constrained finding of NWEA researchers writing in July, 2022 is that there are signs of a recent rebound in achievement, but not enough to make up for losses earlier in the pandemic. [iii]
Table 4 shows what declines in standard deviation units look like in scale score points on the four NAEP tests. I use 2019 standard deviations to make the calculations. A caveat. The current analysis focuses on changes in state scores but the conversions reported in Table 4 are based on national, student-level standard deviations. That technical difference introduces some noise so readers should consider the conversions as ballpark estimates. Despite that limitation, the value of the table is in illustrating how large potential declines are in the context of the historical NAEP changes presented above.
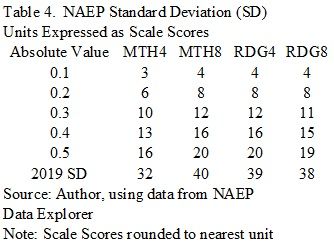
The SD values are labeled "absolute value" because gains or losses are of the same magnitude (i.e, distance from zero), just with different signs ("+" or "-"). If this year's pandemic studies are accurate, we can expect a preponderance of losses in state scores. Take a look at the first row. A decline of 0.1 SD on NAEP represents a loss of 3 to 4 scale score points. Table 3 indicates that in 4th grade math a loss of 4 or more scale score points occurred 2.75% of the time (1.25 + 1.50), 3% in 8th grade math, 4.25% in 4th grade reading, and 5.5% in 8th grade reading--rare but not impossible. Now examine the second row. A loss of 0.2 SDs equates to declines of 6-8 points, which are extremely rare, with frequencies less than 1%; in fact, no state recorded a loss of 6 points in 4th grade math from 2003-2019. [iv]
Conclusion
The 2022 NAEP scores are anticipated to offer the first snapshot of the impact of the covid pandemic on student achievement. The foregoing analysis offers readers a way of interpreting changes in state NAEP scores in an historical context.
[i]The main NAEP is grade based. The age-based NAEP test given since 1969 is known as the long term trend (LTT). It offers only national and regional, not state, scores. Results from the 2022 LTT of nine-year olds is scheduled for release in August.
[ii] Dan Goldhaber, Thomas J. Kane, Andrew McEachin, Emily Morton, Tyler Patterson, Douglas O. Staiger (2022). "The Consequences of Remote and Hybrid Instruction During the Pandemic." CALDER Working Paper No. 267-0522.
[iii] Kuhfeld and Lewis (2022). "Student achievement in 2021-22: Cause for hope and continued urgency," https://www.nwea.org/research/publication/student-achievement-in-2021-22-cause-for-hope-and-continued-urgency/
[iv] NAEP scores are almost always reported rounded to the nearest unit, so Alaska's -5.97 change from 2015 to 2017 would be reported as a six point loss.